Quality tools: fishbone diagram
Contents |
[edit] What is it?
Created by Kaoru Ishikawa in the 1960s, the Fishbone diagram (cause and effect diagram) is a visual tool that shows the potential relationship between a topic (output – effect) and the various factors (inputs – causes) related to it. The diagram resembles the skeleton of a fish as the main causal categories are drawn as ‘bones’ attached to the spine of the fish.
[edit] When and how can I use it?
This tool encourages team participation and is useful in brainstorming. It can be used any time when the cause of a problem is unknown, such as a product defect or issues in the manufacturing or management process. The problem statement and potential categories of causes allow multiple categories of causes to be explored. It can be used as a planning tool to assure that all inputs necessary for a desired outcome have been identified. It can also be used to consider what went right and why during a ‘lessons learned’ exercise at the end of a project.
[edit] Steps
To show the relationships between the cause and effect, and to form a hierarchy of events, the potential causes are arranged based on their level of detail. These are the typical main categories: materials, equipment, people, environment, methods (MEPEM) and sometimes measurement. Facilities, technologies, policies, and practices could be other categories to consider.
1 On the far right side of the diagram write the problem statement. This may be the actual problem or it may be a symptom – at this point you’re not exactly sure and the effect may be refined as more information emerges.
2 Draw a long horizontal arrow pointing to the box. This arrow will serve as the backbone from which further major and minor causes will be categorised and related.
3 Identify potential causes and group them into major categories along the ‘bones’ of the fishbone diagram. Major categories can be established using brainstorming. At this point you shouldn’t be concerned if there is disagreement about whether a category holds the potential cause or not. Just include all of them. Make sure to leave enough space between the major categories on the diagram so that you can add the minor detailed causes.
4 Once you and your team have listed all possible causes you then have the information needed to identify and agree the most likely causes and decide which to investigate further.
[edit] Did you know?
The Fishbone diagram is one of the seven basic quality tools. The Project Management Institute references these seven tools in A Guide to the Project Management Body of Knowledge as an example of a set of general tools useful for planning or controlling project quality.
This article was produced by Jo Dovey and Brian Rutter on behalf of the Chartered Quality Institute and published in Quality World, January 2019.
--ConSIG CWG 18:24, 26 May 2019 (BST)
[edit] Related articles on Designing Buildings Wiki
Featured articles and news
About the 5 Percent Club and its members
The 5% Club; a dynamic movement of employers committed to building and developing the workforce.
New Homes in New Ways at the Building Centre
Accelerating the supply of new homes with MMC.
Quality Planning for Micro and Small to Medium Sized Enterprises
A CIOB Academy Technical Information sheet.
A briefing on fall protection systems for designers
A legal requirement and an ethical must.
CIOB Ireland launches manifesto for 2024 General Election
A vision for a sustainable, high-quality built environment that benefits all members of society.
Local leaders gain new powers to support local high streets
High Street Rental Auctions to be introduced from December.
Infrastructure sector posts second gain for October
With a boost for housebuilder and commercial developer contract awards.
Sustainable construction design teams survey
Shaping the Future of Sustainable Design: Your Voice Matters.
COP29; impacts of construction and updates
Amid criticism, open letters and calls for reform.
The properties of conservation rooflights
Things to consider when choosing the right product.
Adapting to meet changing needs.
London Build: A festival of construction
Co-located with the London Build Fire & Security Expo.
Tasked with locating groups of 10,000 homes with opportunity.
Delivering radical reform in the UK energy market
What are the benefits, barriers and underlying principles.
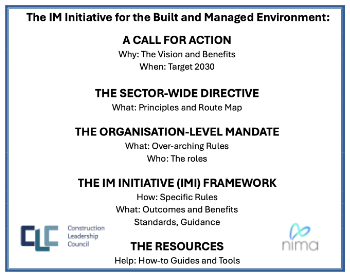
Information Management Initiative IMI
Building sector-transforming capabilities in emerging technologies.
Recent study of UK households reveals chilling home truths
Poor insulation, EPC knowledge and lack of understanding as to what retrofit might offer.


